This blog post was generated by combining my messy notes with ChatGPT ;) The title image was generated using Midjourney with the blog post title as the prompt.
Experiment Length:
Estimated Time: 2 hours
Actual Time: 20 hours
Summary:
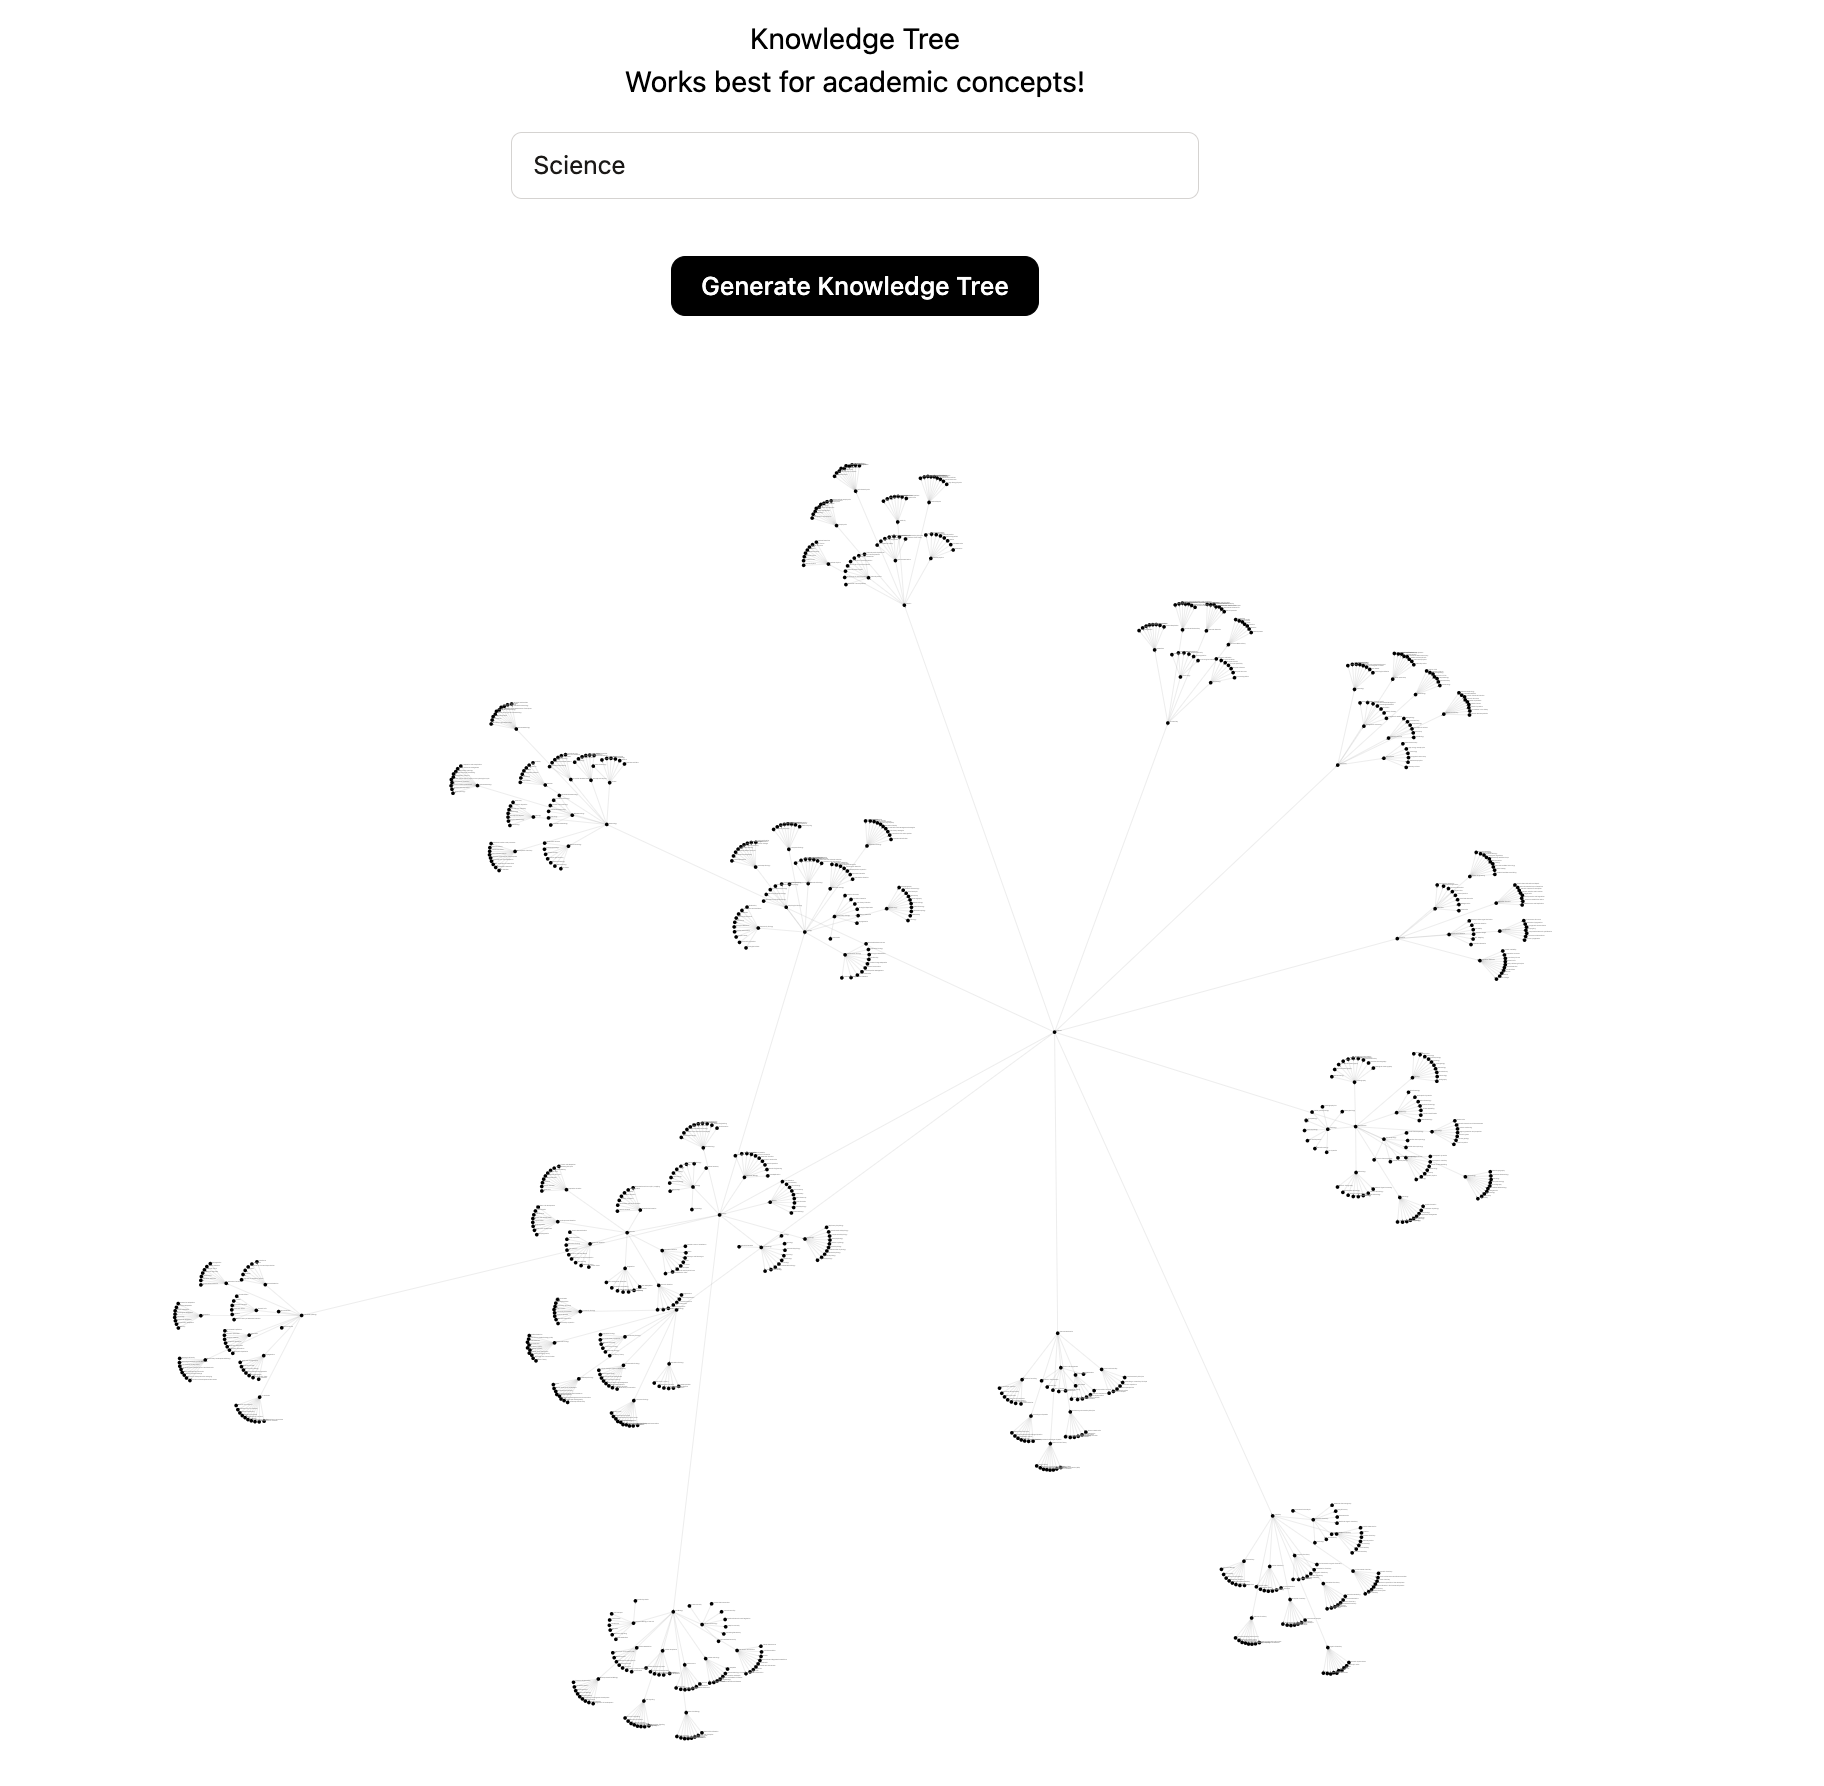
In my quest to understand the expanse of scientific knowledge and how concepts interconnect, I embarked on creating a comprehensive knowledge graph of scientific concepts, showcasing the broad and intricate landscape of science. I named it “Knowledge Tree,” a recursive, LLM-generated graph that doesn’t rely on external data, but on the knowledge embedded within GPT-4 itself.
Distinct from traditional human-curated databases like Freebase ↗, Knowledge Tree is intended to portray the expansive landscape of science, enabling users to explore from general themes to specific details. The core idea is to instantiate a solution where the knowledge graph would be generated recursively by GPT-4, without any external data inputs.
Drawing inspiration from projects like Wikigraphs and Freebase, this graph aims to transform unstructured text into a structured, useful knowledge repository, potentially beneficial for a person to learn concepts alongside a combination of LLMs and spaced repetition. The implications of this experiment are far-reaching, potentially allowing the transformation of any unstructured text into a valuable, updateable knowledge graph. This aligns with my broader goal of creating tools for better information retention and understanding, adding a new dimension to my ongoing exploration in the field of knowledge management.
Big 1006-node graph, Science:
 ]
]
Plan:
The method involved utilizing GPT-4 with a JSON format output using their Function Calling API ↗, integrating technologies like Next.js, Typescript, and D3.js for visualization. The goal was to create a dynamic, visual representation of scientific knowledge, starting from broad categories and delving deeper into specific subfields.
The process started with defining a base model in GPT-4 and structuring the requests to receive JSON formatted data. The key was to generate a graph that could dynamically display the interconnectedness of scientific concepts, starting from broad categories and progressively revealing their subfields.
The process was roughly as follows:
- Symbol Identification: Each node in the graph represented a scientific concept or subfield.
- Recursive Generation: Continuously generated subfields until all possibilities were explored.
- Graph Size: Graph size is roughly 100-1000 nodes for this first version.
- Prompt Construction: Focused on eliciting key academic subconcepts and adjacent fields in science, ensuring minimal overlap and clear hierarchical relationships.
- For getting subconcepts: Name all key academic subconcepts of X. (A subconcept X within concept Y is defined as follows: the set that represents X is a strict subset of the set that represents Y. Please follow this definition strictly)
- Duplication Management: Employed a verification process to identify and reconcile duplicate concepts. (Didn’t have a chance to implement for this experiment)
The graph’s quality was to be evaluated based on two people’s qualitative evaluations:
- My own assessment of the graph’s accuracy and depth
- A domain expert assessment by a friend with significant expertise in Statistics and AI.
Each of us would rate the graph on a scale of 1-10, comparing it to a graph that we might have created ourselves in a day.
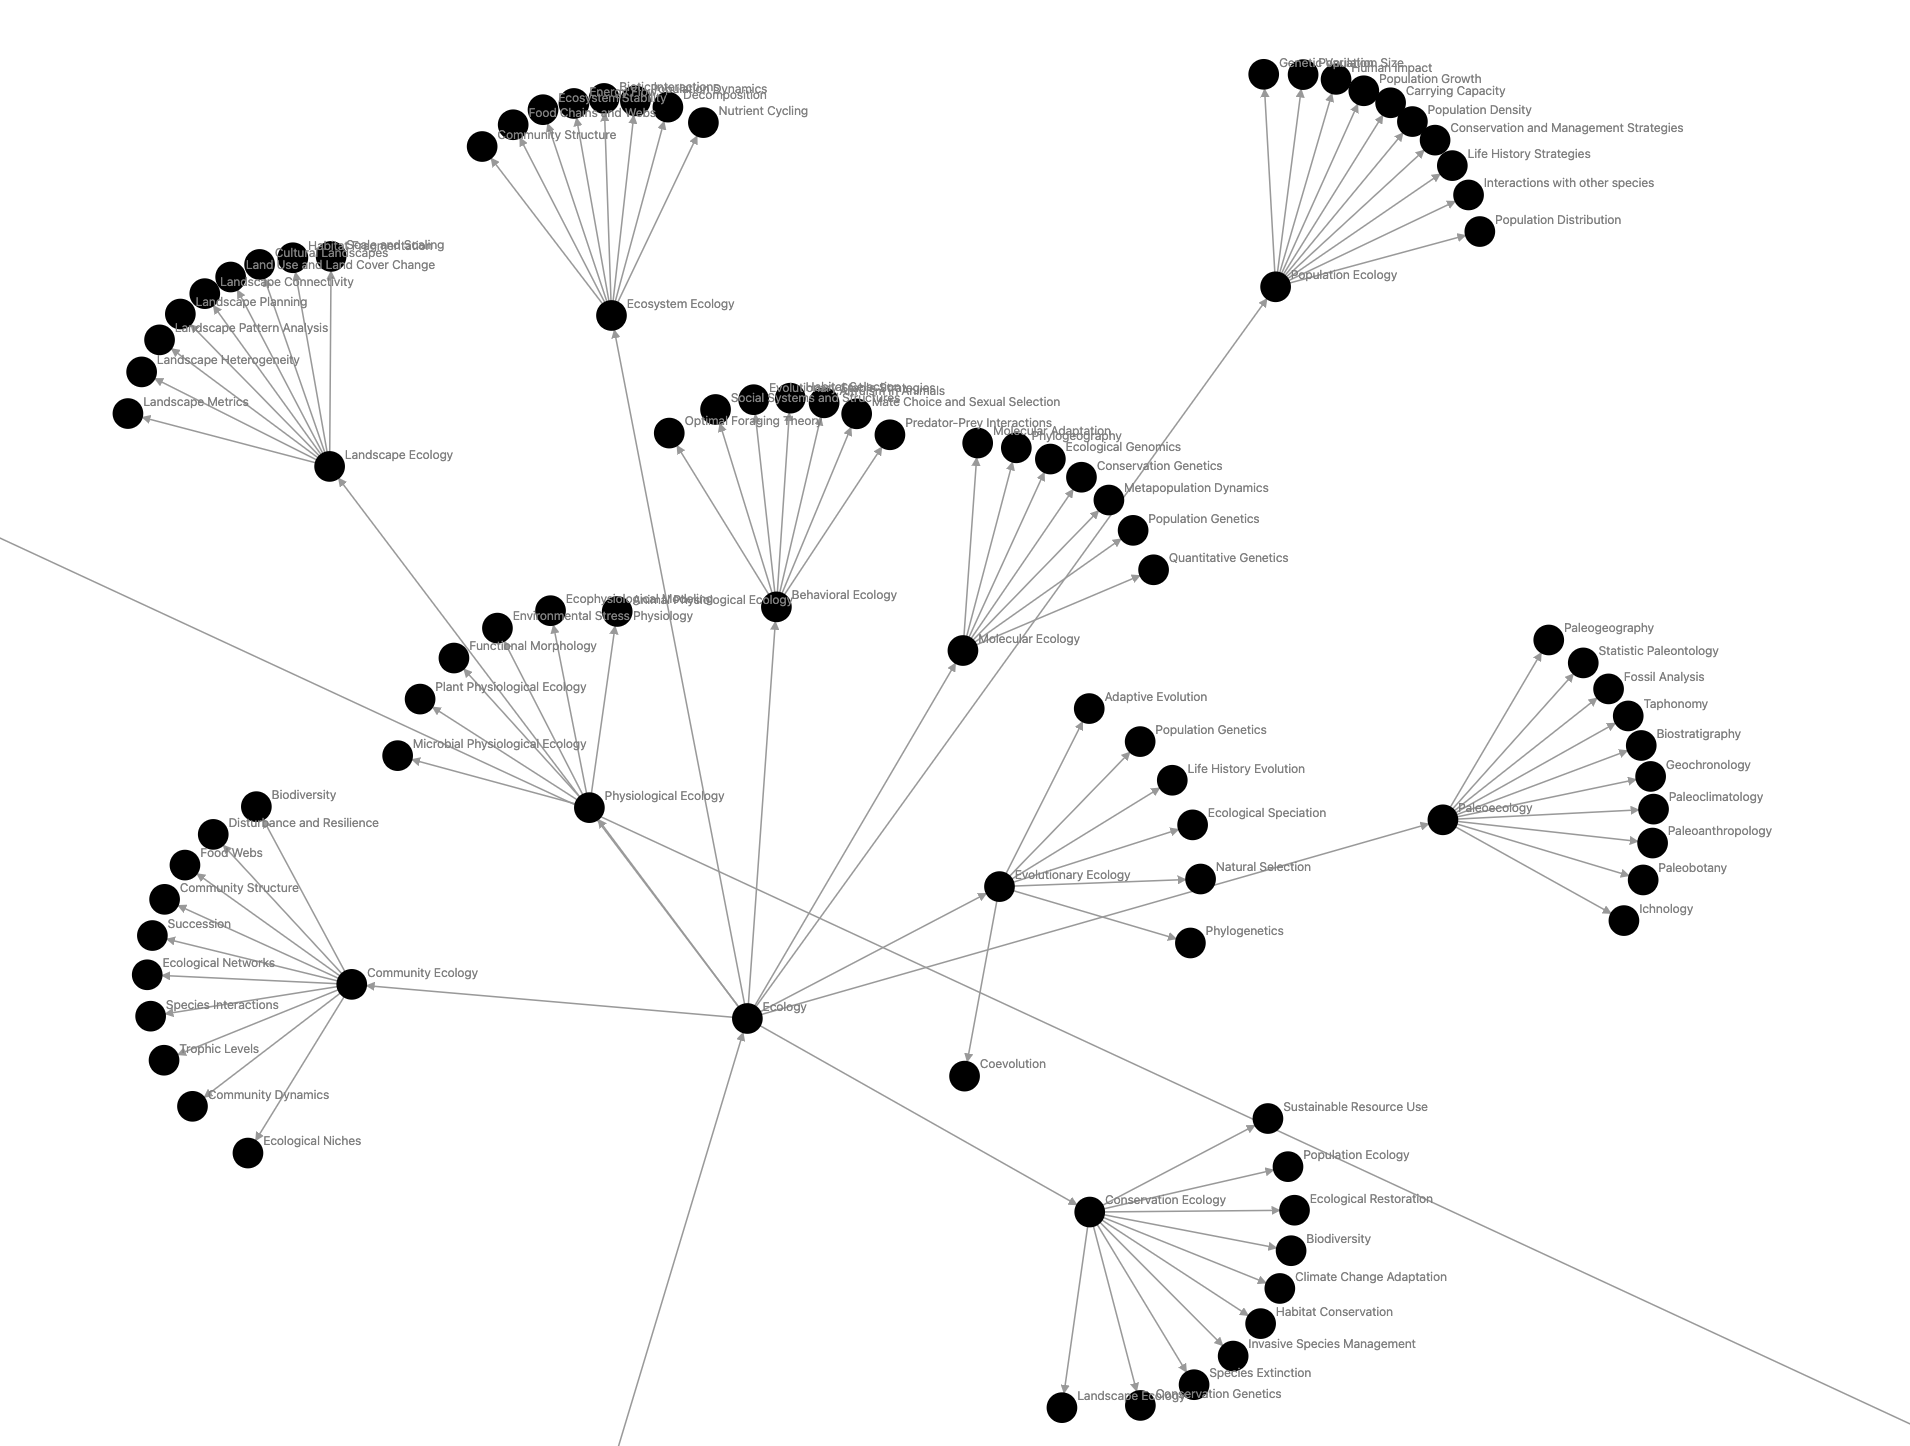
Science > Biology > Ecology subgraph:
Result: 🟢 Pass
Overall, the experiment was a success! Despite some shortcomings, it offered a fascinating glimpse into what a recursively generated knowledge graph could look like. There’s undoubtedly room for improvement, but as a foundational step, it establishes a solid base for more useful knowledge graph manipulations over time.
Over the course of four days, the experiment evolved significantly. I found myself adjusting the scope as the project extended beyond the initial timeframe. Numerous graphs were generated, varying in size from 10 to about 1000 nodes. To manage the process more efficiently, I alternated between using GPT-4 and GPT-3.5, depending on the size and complexity of the graph. For smaller graphs (10-100 nodes), such as those on knowledge graphs, ResNet, and artificial intelligence, I utilized GPT-3.5. For the larger, more comprehensive graph centered around the broad theme of ‘Science’, which had approximately 1000 nodes, I employed GPT-4.
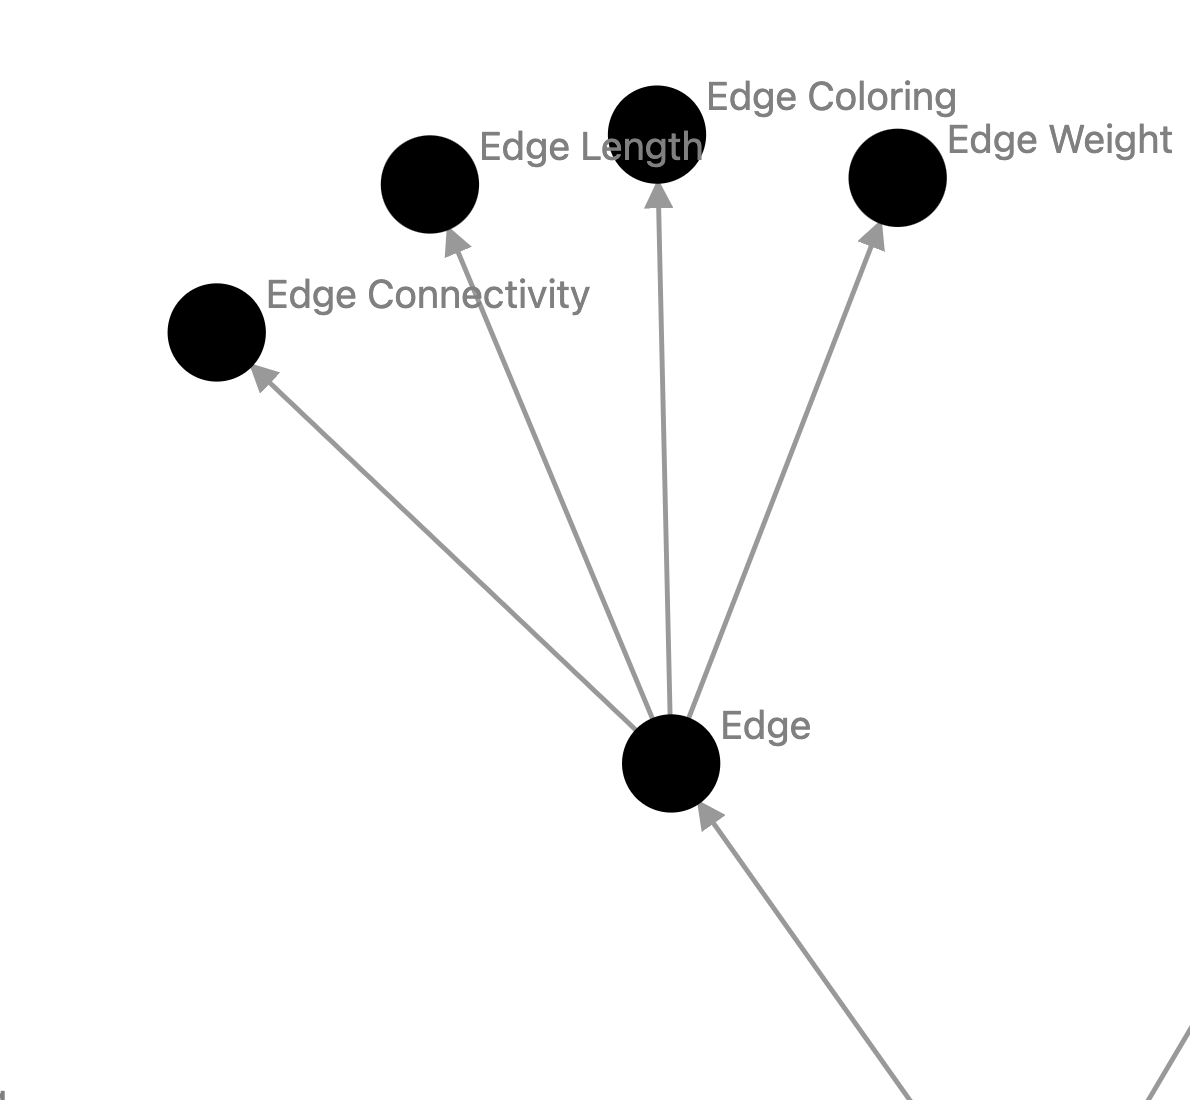
The findings were intriguing but mixed. The graphs maintained a high level of accuracy and relevance within the first one or two layers. However, as the depth increased, the reliability of the connections began to wane. For instance, in a graph themed around ‘knowledge graphs’, the presence of concepts like ‘edge coloring’ under ‘edges’ appeared somewhat tangential and not entirely central to the main theme. This highlighted the need for a more robust validation process in future iterations, possibly involving a second function call to re-verify the authenticity and relevance of each concept as a subconcept of its parent.
Example of listing a not very important concept, Knowledge Graph > Graph Theory > Edge > Edge Coloring:
 Another challenge encountered was the repetition of concepts. The graphs occasionally repeated the same term, used similar terms, or circled back to parent terms. This issue, too, seems addressable with a more thorough verification process.
Example of concepts looping back into themselves, Knowledge graph > Ontology > Domain Ontology > Ontology:
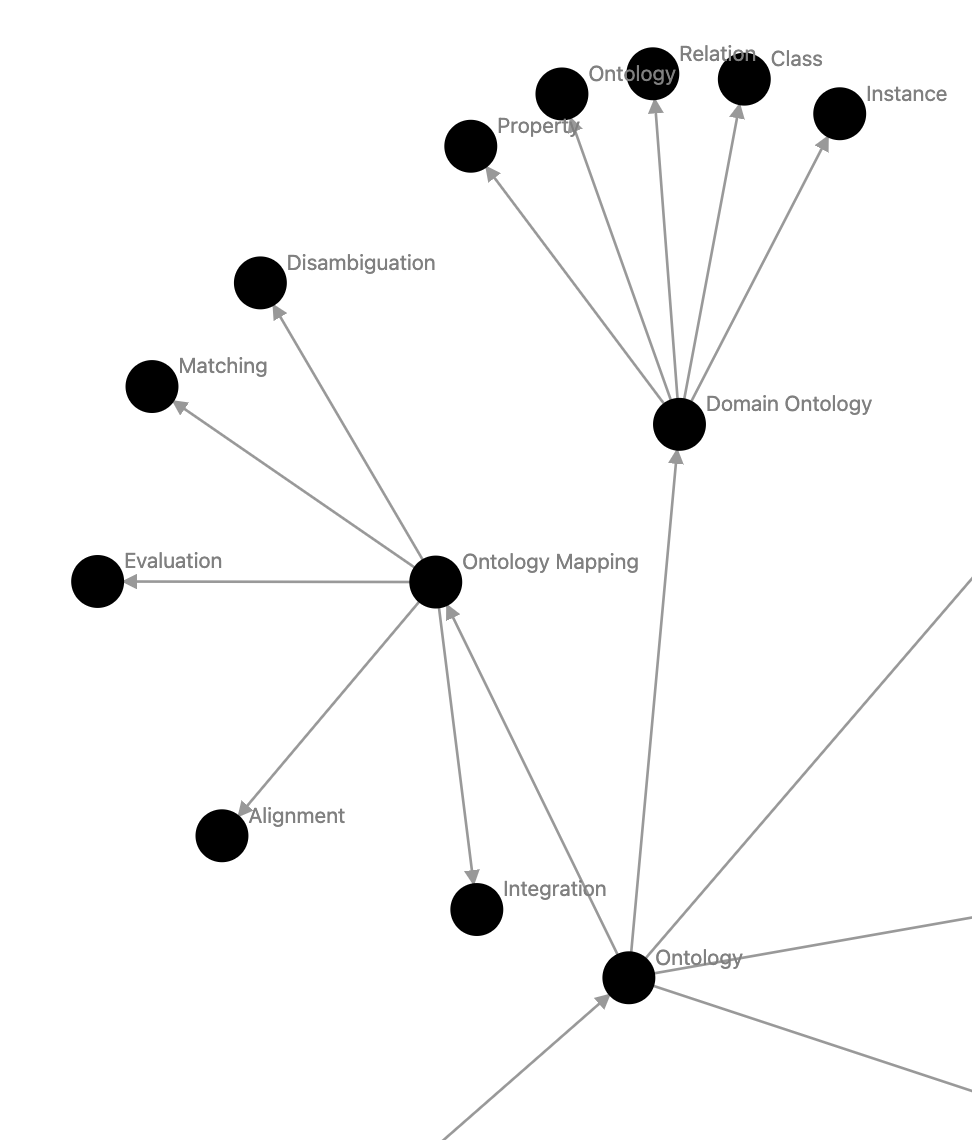 My personal rating for the graph of “Knowledge graph” was a 5 (7 is what I would’ve created, 10 is an expert).
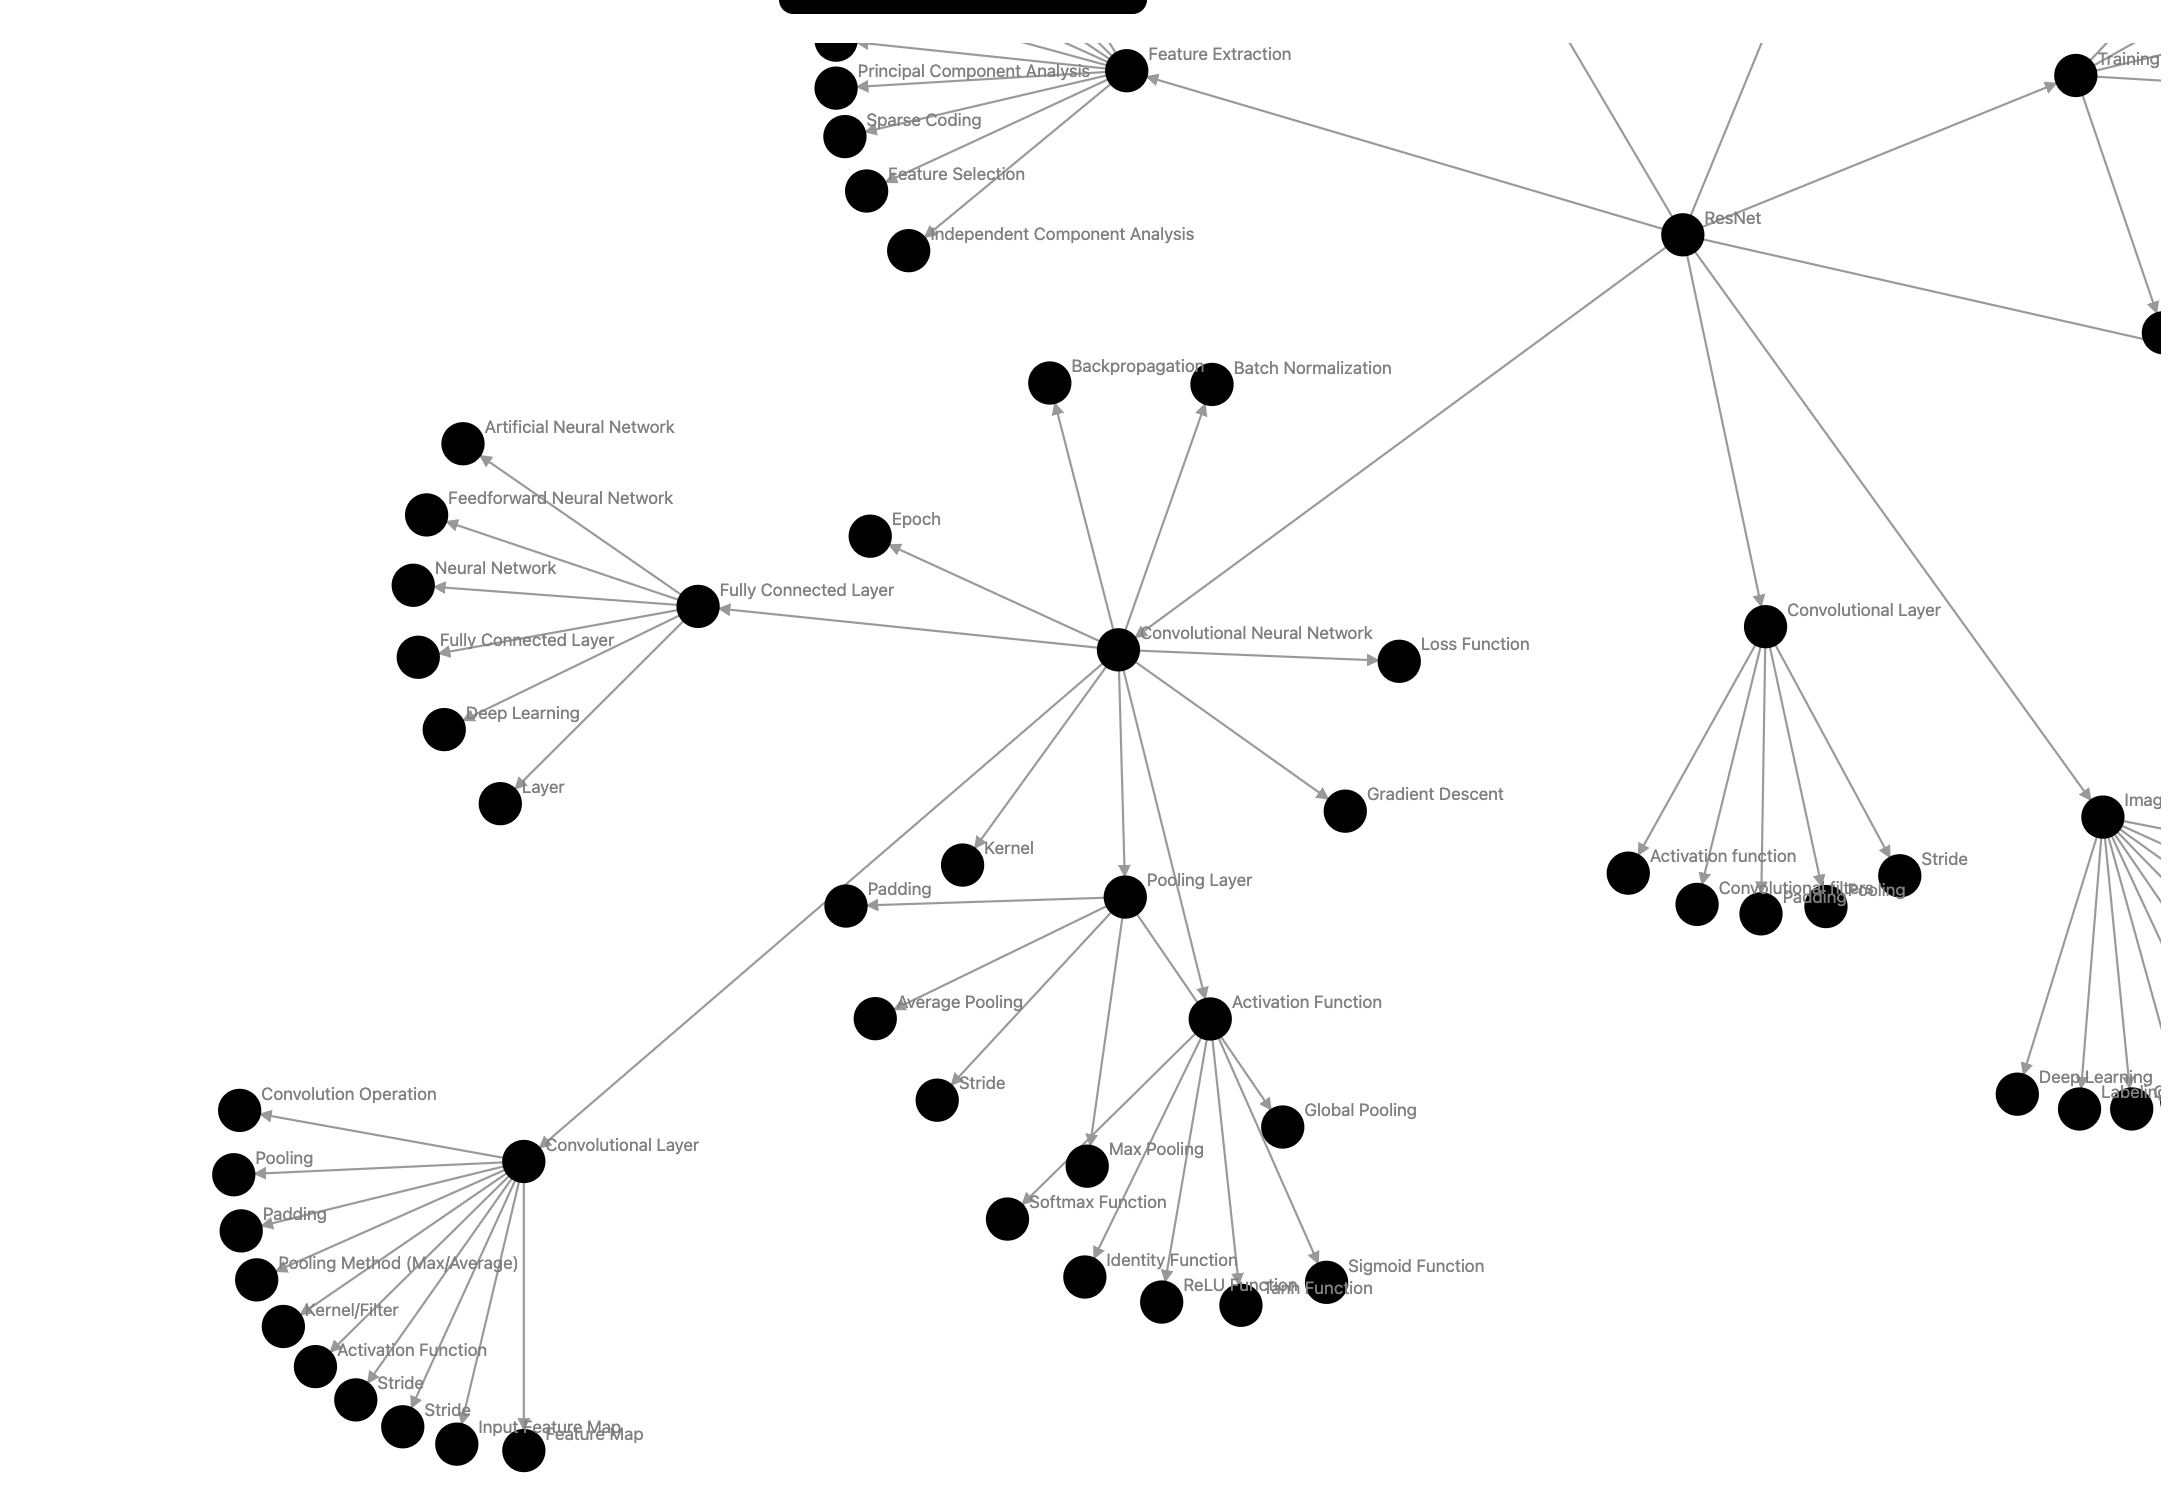
My friend, an expert in AI, provided ratings for the specific graphs such as ‘Artificial Intelligence’ and ‘ResNet’ (Residual Networks), a concept in machine learning.
Here is a summary of what they said
- For the graph of “Artificial intelligence”, from a scale of 1 to 10 (8 is what he would have created, 10 is Andrew Ng), he rated the quality of the graph a 6
- For the graph of “Resnet”, from a scale of 1 to 10 (7 is what he would’ve created, 10 is the author of Resnet ), he rated the quality of the graph a 4
- A recommended change was to add additional layers between certain concepts that weren’t there.
- Another change was to prevent edges from being ordered the wrong way. All directed edges should point towards the subconcept. “70% of the ResNet graph is upside down”
- ex: Deep Learning->ResNet, not the other way around. And there would probably also be additional concept layers between the two.
- Another change is making it a directed graph not just a tree, so nodes would link to each other. There may even be recursive loops.
Graph, ResNet:
What I Learned:
The journey through this project was an eye-opener in terms of time management and the depth of learning involved in such an endeavor. Initially, I anticipated the project would take around 2 hours, but it expanded to an estimated 20 hours. This deviation was mainly due to the diverse range of technologies and concepts I engaged with during the project.
One of the key areas of learning was the Vercel ecosystem. I extensively used Vercel’s ‘ai’ module to interact with OpenAI’s API, which was a big aspect of the project.
Additionally, I explored the use of OpenAI’s function calling API. This exploration was not just about understanding the API but also about applying it effectively in the context of the project. The integration of D3 with React/Next.js was another significant learning curve. While it involved a fair bit of complexity and wrangling, it was a rewarding experience, especially in understanding how LLMs can aid in writing visual code like D3 or CSS. This was particularly useful given my personal pace of learning these technologies.
Another important realization was the effort required to maintain an open-source repository. Observing the status of Vercel’s Platforms repository, which had not been updated for a while and was still using an outdated third-party OpenAI package, I recognized the challenges and responsibilities associated with open-source maintenance.
Lastly, I realized that GPT-4 is really good for debugging CSS and data visualization code such as that of D3.js. D3.js has frustratingly obscure documentation, and I eventually just relied on GPT-4 to tell me how to write my D3.js graph in Next.js.
Overall, this was a really fun project where I learned a lot :)